Multiple Choice
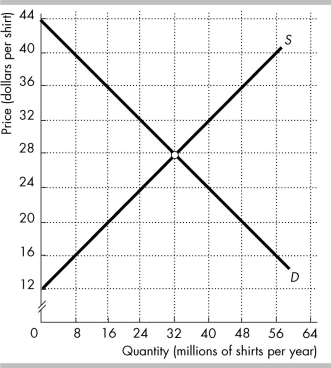 The figure shows the market for shirts in the United States, where D is the domestic demand curve and S is the domestic supply curve. The world price is $20 per shirt.
-In the figure above, international trade ________ producer surplus in the United States by ________.
A) increases; $320 million
B) decreases; $192 million
C) increases; $192 million
D) decreases; $320 million
Correct Answer:
Verified
Related Questions

