Multiple Choice
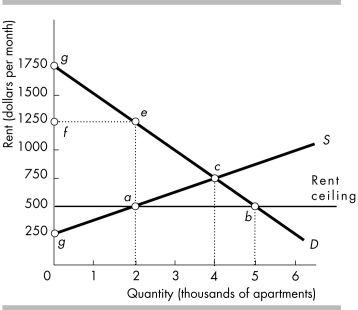
-The above figure shows the demand and supply curves for housing As a result of a rent ceiling at $500, the deadweight loss is represented by the area
A) rectangle feag.
B) triangle gfe.
C) triangle eca.
D) triangle acb.
Correct Answer:
Verified
Related Questions

