Multiple Choice
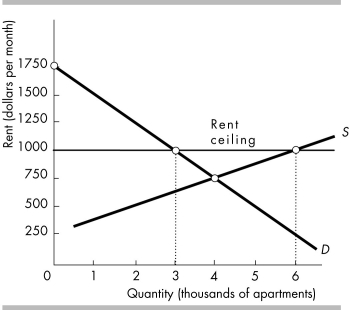
-The above figure shows the demand and supply curves for housing in City B. What would be the effects of a rent ceiling equal to $1000 per month?
A) a surplus equal to 3000 apartments
B) a surplus equal to 250 apartments
C) a shortage equal to 3000 apartments
D) nothing because the rent ceiling has no effect on the equilibrium price and quantity
Correct Answer:
Verified
Related Questions

