Solved

-In the Figure Above, D0 Is the Demand for Labor

Question 130

Multiple Choice

  -In the figure above, D<sub>0</sub> is the demand for labor curve. Imposing a minimum wage of $12 per hour will initially A)  increase employment from 20 to 40 million hours per year. B)  increase employment from 30 to 40 million hours per year. C)  decrease employment from 40 to 20 million hours per year. D)  decrease employment from 30 to 20 million hours per year.
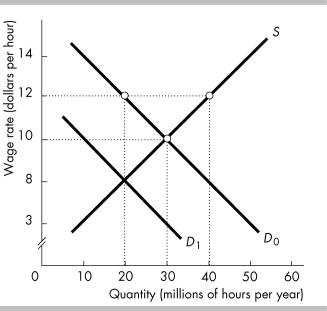
-In the figure above, D0 is the demand for labor curve. Imposing a minimum wage of $12 per hour will initially


A) increase employment from 20 to 40 million hours per year.
B) increase employment from 30 to 40 million hours per year.
C) decrease employment from 40 to 20 million hours per year.
D) decrease employment from 30 to 20 million hours per year.

Correct Answer:

verifed

Verified

Unlock this answer now
Get Access to more Verified Answers free of charge

Related Questions

Unlock this Answer For Free Now!

View this answer and more for free by performing one of the following actions

qr-code

Scan the QR code to install the App and get 2 free unlocks

upload documents

Unlock quizzes for free by uploading documents