Multiple Choice
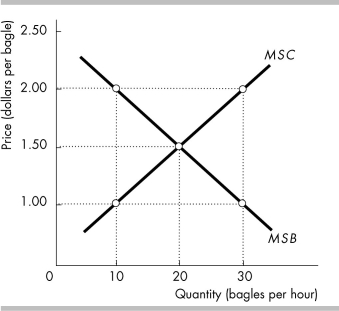
-The figure illustrates the market for bagels. Initially the market is in equilibrium, Then the number of bagels produced is cut from 20 to 10 an hour and the price rises to $2.00 per bagel. Consumer surplus decreases by
A) $5.00 an hour.
B) $2.50 an hour.
C) $7.50 an hour.
D) $0.50 a bagel.
Correct Answer:
Verified
Related Questions

