Multiple Choice
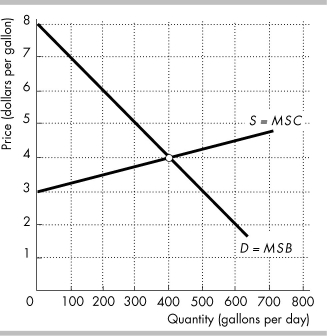 The figure shows the competitive market for milk.
-In the figure above, when the market is in equilibrium, what is the total surplus?
A) $1,000
B) $800
C) $200
D) $1,600
Correct Answer:
Verified
Related Questions
The figure shows the competitive market for milk.
-In the figure above, when the market is in equilibrium, what is the total surplus?
A) $1,000
B) $800
C) $200
D) $1,600
Correct Answer:
Verified

