Essay
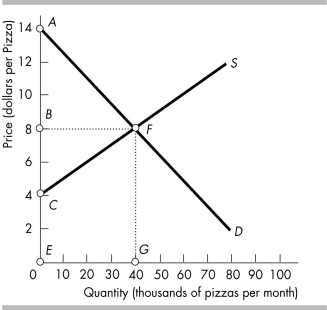
-The figure above shows the market supply and market demand curves for pizza. If the market is at its equilibrium, what area in the graph above represents:
a) consumer surplus?
b) producer surplus?
Correct Answer:
Verified
Related Questions
Q412: Explain the principle "Make the poorest as
Q413: Q414: Why does the problem of the big Q415: Bill Gates is a founder of Microsoft Q416: Maria helps tutor students taking economics. The Q418: According to the "fair rules" view of Q419: Jason hires Maria to tutor him in![]()
Unlock this Answer For Free Now!
View this answer and more for free by performing one of the following actions

Scan the QR code to install the App and get 2 free unlocks

Unlock quizzes for free by uploading documents