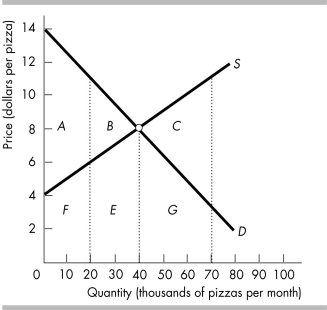
-The figure above shows the market supply and market demand for pizza.
a) What is the efficient quantity of pizzas?
b) If 70,000 pizzas are produced, what area represents the deadweight loss?
c) Why does the deadweight loss in part (b) occur?
d) If 20,000 pizzas are produced, what area represents the deadweight loss?
e) Why does the deadweight loss in part (d) occur?
Correct Answer:
Verified
View Answer
Unlock this answer now
Get Access to more Verified Answers free of charge
Q429: Command system allocates resources by the order
Q430: Jason wants to hire Maria to tutor
Q431: Marginal cost is the minimum price that
Q432: As long as production is such that
Q433: In a competitive equilibrium, the total consumer
Q435: Producer surplus is the price of a
Q436: Although the efficient quantity to produce of
Q437: If the hot dog vendors at Yankee
Q438: If the marginal social benefit exceeds the
Q439: Consumers don't always have to pay the
Unlock this Answer For Free Now!
View this answer and more for free by performing one of the following actions

Scan the QR code to install the App and get 2 free unlocks

Unlock quizzes for free by uploading documents