Multiple Choice
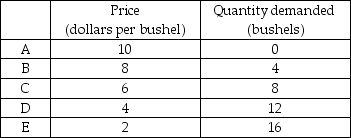
-The table above gives the demand schedule for peas. Between point A and point B, the price elasticity of demand equals
A) 0.11.
B) 0.50.
C) 0.22.
D) 9.09.
Correct Answer:
Verified
Related Questions
Q37: The worst drought in over 50 years
Q38: Florida State University has just lowered the
Q39: A fall in the price of cabbage
Q40: If the price of a soda increases
Unlock this Answer For Free Now!
View this answer and more for free by performing one of the following actions

Scan the QR code to install the App and get 2 free unlocks

Unlock quizzes for free by uploading documents