Multiple Choice
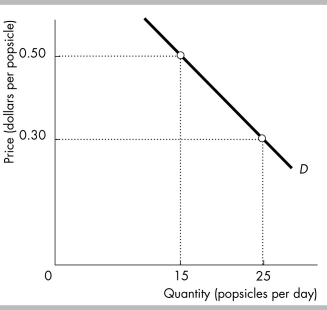
-The figure shows the demand curve for popsicles. The price elasticity of demand when the price of a popsicle increases from $0.30 to $0.50 is
A) 0.
B) 1.
C) 1/2.
D) 2.
Correct Answer:
Verified
Related Questions
Q71: If the quantity demanded changes by a
Q72: Demand is perfectly inelastic when
A) shifts in
Q73: When the price elasticity of demand for
Q74: Marvin loves chocolate truffles. As the price
Unlock this Answer For Free Now!
View this answer and more for free by performing one of the following actions

Scan the QR code to install the App and get 2 free unlocks

Unlock quizzes for free by uploading documents