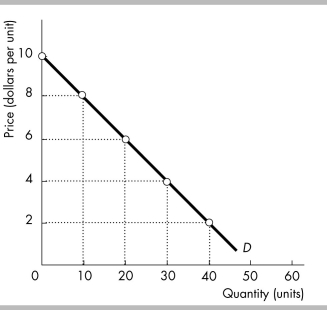
-The figure above illustrates a linear demand curve. By comparing the price elasticity in the $2 to $4 price range with the elasticity in the $8 to $10 range, you can conclude that the elasticity is
A) greater in the $8 to $10 range.
B) greater in the $2 to $4 range.
C) the same in both price ranges.
D) greater in the $8 to $10 range when the price rises but greater in the $2 to $4 range when the price falls.
Correct Answer:
Verified
Q105: The demand curve for microwave popcorn is
Q106: Q107: If the demand curve for a good Q108: Q109: The demand for computer chips is a Q111: A straight-line demand curve with negative slope Q112: Which of the following statements is FALSE? Q113: The demand for bus rides is a Q114: At the midpoint of a downward sloping Q115: Unlock this Answer For Free Now! View this answer and more for free by performing one of the following actions Scan the QR code to install the App and get 2 free unlocks Unlock quizzes for free by uploading documents![]()
![]()
A)![]()

