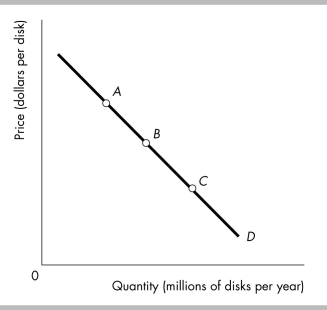
-The above figure shows a linear (straight-line) demand curve. Starting at point A and then moving to point B and then point C, the price elasticity of demand
A) increases.
B) decreases.
C) increases and then decreases.
D) decreases and then increases.
Correct Answer:
Verified
Q243: Which of the following is likely to
Q244: If a 4 percent rise in the
Q245: Q246: By reviewing its sales records, Dell economists Q247: The cross elasticity of demand is calculated Q249: Toothpaste and toothbrushes are complements, so the Q250: If the price elasticity of demand for Q251: Moving up (to the left) along a![]()
Unlock this Answer For Free Now!
View this answer and more for free by performing one of the following actions

Scan the QR code to install the App and get 2 free unlocks

Unlock quizzes for free by uploading documents