Multiple Choice
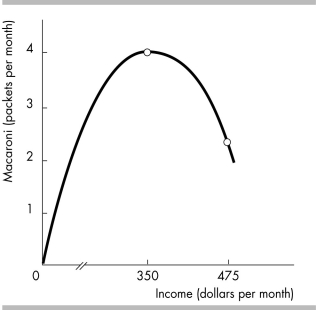
-The figure shows the relationship between Moira's income and the quantity of macaroni that she demands. When income is less than $350 per month, macaroni
A) is an inferior good.
B) is a normal good.
C) has many substitutes.
D) has negative income elasticity.
Correct Answer:
Verified
Related Questions
Q345: Q346: If income increases by 2.0 percent, and Q347: Duke increased his spending on steak from Q348: A 10 percent decrease in the price Q349: As income rises, the share of income Q351: A 10 percent decrease in income decreases Unlock this Answer For Free Now! View this answer and more for free by performing one of the following actions Scan the QR code to install the App and get 2 free unlocks Unlock quizzes for free by uploading documents![]()

