Multiple Choice
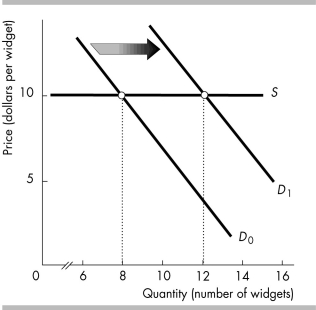
-The increase in the demand for widgets, shown in the figure above, is the result of a decrease in the price of McBoover devices from $11 to $9. Therefore, the cross-price elasticity for these two products is
A) -2.0.
B) -0.5.
C) 0.5.
D) 2.0.
Correct Answer:
Verified
Related Questions
Q339: Paul's monthly income decreased from $2,500 to
Q340: The income elasticity of demand for vacations
Q341: Q342: In the nation of Transporta, the income Q343: The income elasticity of demand for restaurant![]()
Unlock this Answer For Free Now!
View this answer and more for free by performing one of the following actions

Scan the QR code to install the App and get 2 free unlocks

Unlock quizzes for free by uploading documents