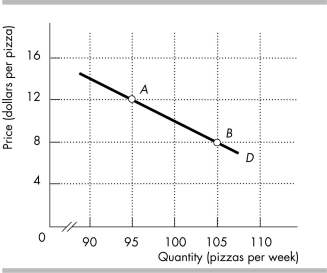
-The figure above shows the demand curve for pizza. Using the midpoint method and moving from point A to point B, calculate the
a) percentage change in price.
b) percentage change in quantity demanded.
c) price elasticity of demand.
Correct Answer:
Verified
View Answer
Unlock this answer now
Get Access to more Verified Answers free of charge
Q484: Q485: Suppose the quantity supplied of computers increases Q486: A 10 percent increase in income brings Q487: Suppose bad weather decreases the wheat harvest Q488: Q490: The price elasticity of demand for adults Q491: If the price increases by 20 percent Q492: When the price of oil is $80 Q493: Consider two goods: peanut butter and jelly. Q494: Unlock this Answer For Free Now! View this answer and more for free by performing one of the following actions Scan the QR code to install the App and get 2 free unlocks Unlock quizzes for free by uploading documents![]()
![]()
![]()

