Multiple Choice
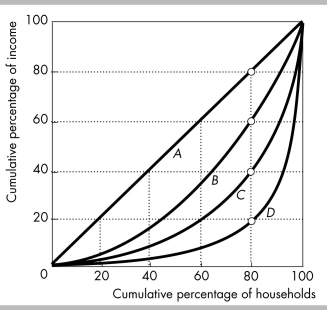
-In the figure above, the Lorenz curve that shows the richest 20 of households percent receiving 60 percent of all income is
A) curve A.
B) curve B.
C) curve C.
D) curve D.
Correct Answer:
Verified
Related Questions
-In the figure above, the Lorenz curve that shows the richest 20 of households percent receiving 60 percent of all income is
A) curve A.
B) curve B.
C) curve C.
D) curve D.
Correct Answer:
Verified

