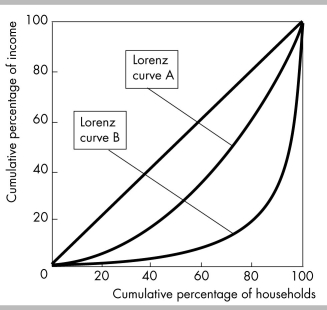
-The figure above shows two Lorenz curves, one before income redistribution and one after income redistribution. Lorenz curve B represents
A) market income.
B) money income.
C) money income before taxes.
D) income after taxes.
Correct Answer:
Verified
Q239: Q240: A proportional income tax is defined as Q241: State colleges are an example of Q242: Q243: The table shows the distributions of market Q245: The table shows the distributions of market Q246: Market income in the United States is Q247: The table shows the distributions of market Q248: Considering the tax and transfer system in Q249: Unlock this Answer For Free Now! View this answer and more for free by performing one of the following actions Scan the QR code to install the App and get 2 free unlocks Unlock quizzes for free by uploading documents![]()
A) income![]()
![]()

