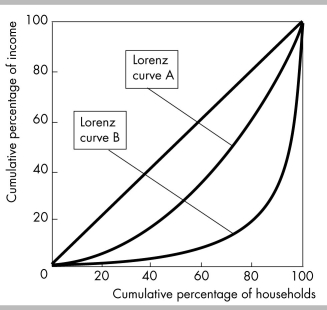
-The figure above shows two Lorenz curves, one before income redistribution and one after income redistribution. The difference between the two curves equals
A) market income.
B) money income.
C) the redistribution of income.
D) the amount of taxes paid.
Correct Answer:
Verified
Q244: Q245: The table shows the distributions of market Q246: Market income in the United States is Q247: The table shows the distributions of market Q248: Considering the tax and transfer system in Q250: All of the following are programs that Q251: The table shows the distributions of market Q252: Which of the following is an example![]()
Unlock this Answer For Free Now!
View this answer and more for free by performing one of the following actions

Scan the QR code to install the App and get 2 free unlocks

Unlock quizzes for free by uploading documents