Income (percent of total)
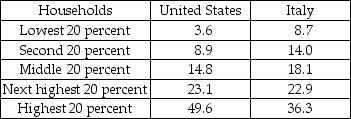
-The table above shows the income distribution in the United States and Italy in a recent year.
a) Draw a Lorenz curve for the United States. According to your graph, what is the percentage of income received by the poorest 30 percent of households? The richest 10 percent?
b) On the same graph, draw a Lorenz curve for Italy. According to your graph, what is the percentage of income received by the poorest 30 percent of households? The richest 10 percent?
c) Draw the line of equality. How is it related to the Lorenz curve?
d) Is income distributed more equally in the United States or in Italy? Which country's Gini ratio is closer to zero? Explain your answers.
Correct Answer:
Verified
View Answer
Unlock this answer now
Get Access to more Verified Answers free of charge
Q338: The actual income distribution might be more
Q339: If income is equally distributed, the Gini
Q340: The income distribution is a more accurate
Q341: Q342: Differences in human capital and discrimination can Q344: The demand curve for high-skilled workers lies Q345: A progressive tax is a tax that Q346: Wealth inequality persists across generations due, in Q347: "The Big Tradeoff" refers to the effect Q348: Income (percent of total)![]()
![]()
Unlock this Answer For Free Now!
View this answer and more for free by performing one of the following actions

Scan the QR code to install the App and get 2 free unlocks

Unlock quizzes for free by uploading documents