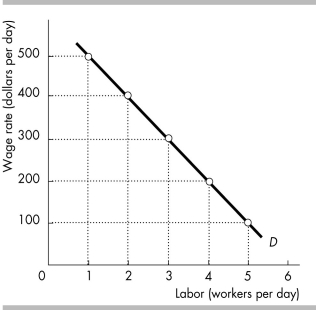
-The figure above shows a local lawn cutting service's demand for labor curve when the price of cutting an acre of lawn is $50 per acre. If the wage rate rises from $100 per day to $200 per day, the firm's demand for labor curve
A) shifts leftward.
B) shifts rightward.
C) does not shift at all, but the firm moves upward along the curve.
D) None of the above because this change shifts the supply of labor curve.
Correct Answer:
Verified
Q96: A fall in the price of a
Q97: If the price of a firm's output
Q98: Due to a recession, Hostess Bakeries found
Q99: An increase in the price of a
Q100: The demand for labor depends on I.
Q102: New technology
A) definitely increases a firm's demand
Q103: A firm's price rises. As a result,
Unlock this Answer For Free Now!
View this answer and more for free by performing one of the following actions

Scan the QR code to install the App and get 2 free unlocks

Unlock quizzes for free by uploading documents