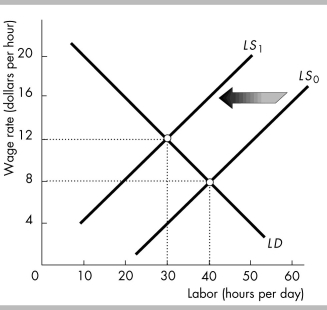
-The figure above shows the labor demand and labor supply curves for workers in local fast-food restaurants. The fast-food restaurant industry is competitive. A decrease in the supply of labor shifts the labor supply curve from LS0 to LS1. Fast-food restaurants hire ________ and total labor income earned by the fast-food workers ________.
A) 40 hours of labor a day; increases
B) 30 hours of labor a day; decreases
C) 40 hours of labor a day; decreases
D) 30 hours of labor a day; increases
Correct Answer:
Verified
Q142: Which of the following will increase the
Q143: If a union is able to decrease
Q144: Which of the following will increase the
Q145: In order for there to be a
Q146: For many jobs, as wages increase, the
Q148: An individual's labor supply curve will have
Q149: When the _ effect dominates the _
Unlock this Answer For Free Now!
View this answer and more for free by performing one of the following actions

Scan the QR code to install the App and get 2 free unlocks

Unlock quizzes for free by uploading documents