Multiple Choice
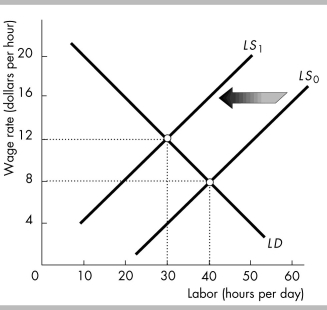
-The figure above shows the labor demand and labor supply curves for workers in local fast-food restaurants. The fast-food restaurant industry is competitive. A decrease in the supply of labor shifts the labor supply curve from LS0 to LS1. The wages of fast-food workers
A) decrease by $4 per hour.
B) decrease by $10 per hour.
C) increase by $4 per hour.
D) remain the same.
Correct Answer:
Verified
Related Questions

