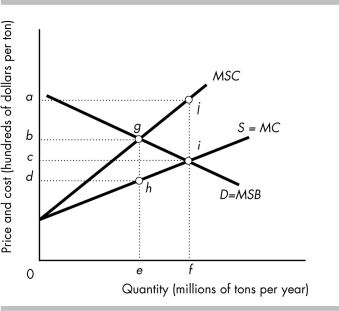
-The figure above shows the market for steel, the production of which creates pollution.
a) What point represents the equilibrium price and what point represents the equilibrium quantity in an unregulated, competitive market?
b) What area represents the deadweight loss of the unregulated, competitive market outcome?
c) What point represents the efficient quantity?
d) If the output level in part (c) was achieved through the use of a government imposed tax, what price would consumers pay? What price would the producers receive? What distance represents the amount of the tax?
e) If government successfully uses marketable permits issued under a cap-and-trade policy to eliminate the external cost, what point represents how much output would be produced?
Correct Answer:
Verified
View Answer
Unlock this answer now
Get Access to more Verified Answers free of charge

