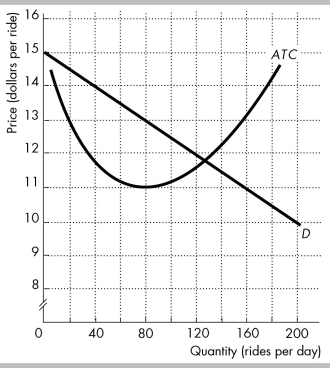
 In the figure, D is the demand curve for taxi rides in a town, and ATC is the average total cost curve of a taxi company.
-In an oligopoly market, the Herfindahl-Hirschman Index is usually
A) greater than 2,500.
B) below 1,000.
C) between 100 and 1,000.
D) between 200 and 2,000.
Correct Answer:
Verified
Q28: Game theory is most useful for analyzing
A)
Q29: In _ market structure, a firm's output
Q30: An market in which the Herfindahl-Hirschman Index
Q31: Game theory is applicable to oligopoly behavior
Q32: _ is a group of firms that
Q34: When producers agree to restrict output, raise
Q35: Game theory is most useful for determining
Q36: In the market for batteries, the three
Q37: Which of the following is characteristic of
Q38: Of the following, the best example of
Unlock this Answer For Free Now!
View this answer and more for free by performing one of the following actions

Scan the QR code to install the App and get 2 free unlocks

Unlock quizzes for free by uploading documents