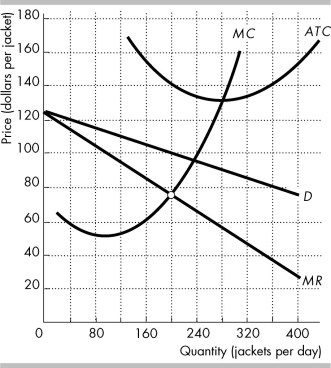
 The figure shows the demand curve for Gap jackets (D) , and Gap's marginal revenue curve (MR) , marginal cost curve (MC) , and average total cost curve (ATC) .
-In the figure above, Gap's economic ________ is ________.
A) loss; $8,000
B) loss; $13,000
C) profit; $7,200
D) profit; $13,000
Correct Answer:
Verified
Q122: Freedom of entry and exit in monopolistic
Q123: Q124: Q125: Which of the following is TRUE regarding Q126: In the long run, a firm in Q128: Which of the following statements regarding the Q129: In the long run, a firm in Q130: Which of the following is FALSE regarding Q131: Consider a monopolistically competitive industry which is Q132: If the market demand in a monopolistically![]()
![]()
Unlock this Answer For Free Now!
View this answer and more for free by performing one of the following actions

Scan the QR code to install the App and get 2 free unlocks

Unlock quizzes for free by uploading documents