Multiple Choice
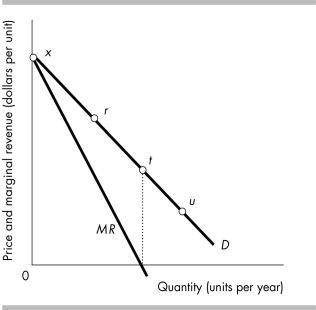
-The figure above shows a monopoly firm's demand curve. If the price and quantity of haircuts move from point t to point r, the monopoly's
A) total revenue will rise.
B) total revenue will fall.
C) total revenue will remain the same.
D) marginal revenue will decrease.
Correct Answer:
Verified
Related Questions

