Multiple Choice
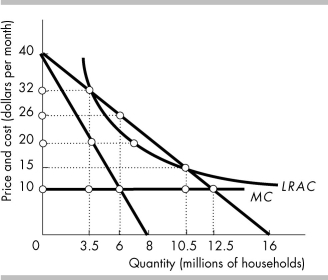
-Consider the market for cable television in the figure above. This graph depicts a natural monopoly because the
A) marginal cost curve is constant.
B) demand curve is downward sloping.
C) average cost curve is declining as it crosses the demand curve.
D) marginal revenue curve is downward sloping.
Correct Answer:
Verified
Related Questions

