Essay
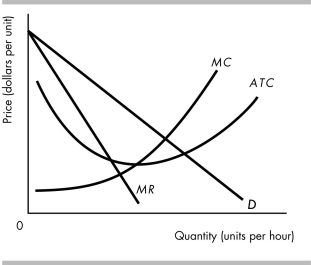
-The above figure represents the cost, demand, and marginal revenue curves for a monopolist.
a) Indicate the price and quantity a single-price monopolist selects by labeling the price Pm and the quantity Qm.
b) In the figure, lightly shade in the area that represents the single-price monopoly's economic profit.
c) Indicate the quantity a perfectly price-discriminating monopolist selects by labeling it Qppd.
d) In the figure, more darkly shade the area that represents the additional economic profit the monopoly earns as a result of the perfect price discrimination.
Correct Answer:
Verified
View Answer
Unlock this answer now
Get Access to more Verified Answers free of charge
Related Questions
Q570: A monopoly always operates on the elastic

