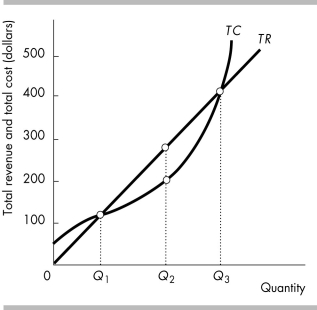
-The above figure illustrates a firm's total revenue and total cost curves. Which one of the following statements is FALSE?
A) Economic profit is the vertical distance between the total revenue curve and the total cost curve.
B) At output Q1 the firm makes zero economic profit.
C) At an output above Q3 the firm incurs an economic loss.
D) At output Q2 the firm incurs an economic loss.
Correct Answer:
Verified
Q113: Q114: For a firm in perfect competition, a Q115: Q116: Q117: Q119: A perfectly competitive firm maximizes its profit Q120: Q121: Jane's Garage Cleaning is a perfectly competitive Q122: A perfectly competitive firm's marginal cost exceeds Q123: Unlock this Answer For Free Now! View this answer and more for free by performing one of the following actions Scan the QR code to install the App and get 2 free unlocks Unlock quizzes for free by uploading documents![]()
![]()
![]()
![]()
![]()
![]()

