Multiple Choice
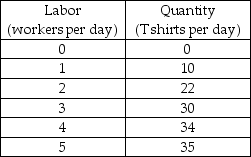
-The table above shows some data that describe Tom's T-Shirts' total product when Tom has 1 sewing machine. An increase in the number of workers from 1 to 2 a day increases average product of labor from ________ T shirts per worker and marginal product of labor is ________ T shirts per worker.
A) 10 to 11; 22
B) 10 to 22; 12
C) 10 to 22; 22
D) 10 to 11; 12
Correct Answer:
Verified
Related Questions

