Multiple Choice
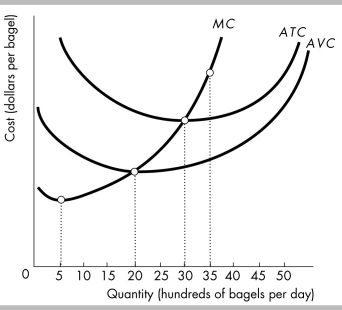
-The above figure shows the costs at Barney's Bagel Bakery. After 3000 bagels are produced each day, the ATC curve starts to slope upward because the
A) MC curve slopes upward.
B) MC exceeds the ATC.
C) AFC curve (not shown) starts to slope upward.
D) None of the above answers is correct.
Correct Answer:
Verified
Related Questions

