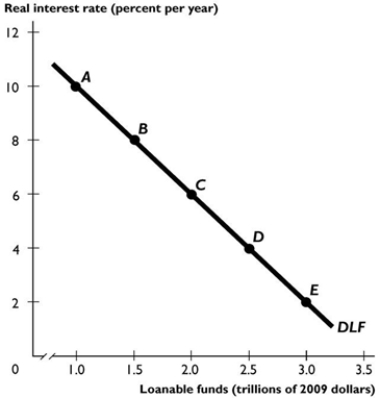
 The figure above shows the demand for loanable funds curve.
-In the figure above, a movement from point A to point C can be the result of
A) an increase in the government budget deficit.
B) a rise in the real interest rate.
C) an increase in expected profit.
D) a fall in the real interest rate.
E) a decrease in expected profit.
Correct Answer:
Verified
Q54: Q55: The supply of loanable funds schedule shows Q56: If a government has a budget deficit, Q57: Q58: Q60: The supply of loanable funds curve has Q61: Since the financial crisis of 2008-09, expected Q62: Suppose the government has a budget deficit Unlock this Answer For Free Now! View this answer and more for free by performing one of the following actions Scan the QR code to install the App and get 2 free unlocks Unlock quizzes for free by uploading documents![]()
![]()
![]()

