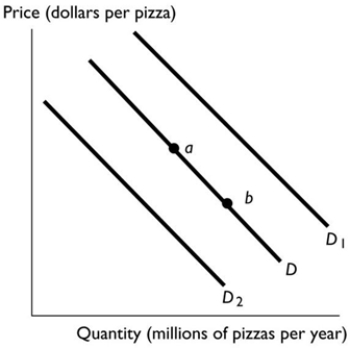
 In the above figure, the movement from point a to point b reflects
A) an increase in the number of people who eat pizza.
B) a decrease in the price of pizza.
C) an increase in the demand for pizza.
D) an increase in the price of the tomato sauce used to produce pizza.
E) a decrease in the number of firms producing pizza.
Correct Answer:
Verified
Q22: A huge 50 per cent off sale
Q27: Consider the market for smart phones. Which
Q28: Two minute noodles are a staple food
Q30: In a recession, consumers have less income
Q31: A popular dinner among university students today
Q32: The impact of an increase in the
Q33: Scooters are a normal good and buyers'
Q34: Which of the following increases the demand
Q37: The graph illustrates the demand for peanuts.
Q38: What happens to the demand for a
Unlock this Answer For Free Now!
View this answer and more for free by performing one of the following actions

Scan the QR code to install the App and get 2 free unlocks

Unlock quizzes for free by uploading documents