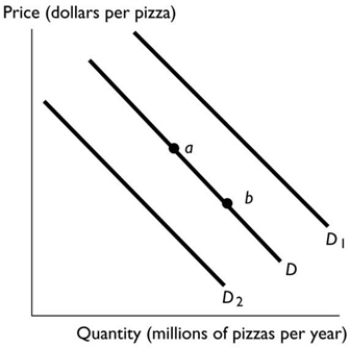
 In the above figure, the shift in the demand curve from D to D1 can be the result of
A) an increase in the price of soft drinks, a complement to pizza.
B) an increase in the price of pizza.
C) a change in quantity demanded.
D) an increase in the price of a sub sandwich, a substitute for pizza.
E) a decrease in income if pizza is a normal good.
Correct Answer:
Verified
Q23: If macaroni and cheese is an inferior
Q28: Two minute noodles are a staple food
Q29: If the demand for digital cameras increases
Q33: Scooters are a normal good and buyers'
Q37: The graph illustrates the demand for peanuts.
Q38: What happens to the demand for a
Unlock this Answer For Free Now!
View this answer and more for free by performing one of the following actions

Scan the QR code to install the App and get 2 free unlocks

Unlock quizzes for free by uploading documents