Multiple Choice
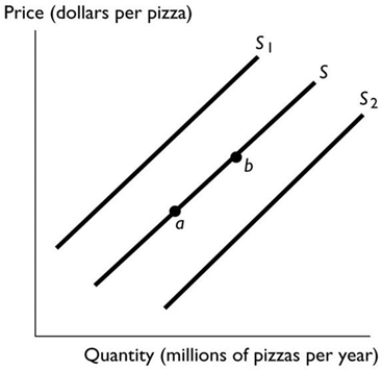 In the above figure, the shift in the supply curve from S to S2 reflects
A) a decrease in the supply of pizza AND a simultaneous decrease in the quantity of pizza supplied.
B) a decrease in the quantity of pizza supplied.
C) an increase in the quantity of pizza supplied.
D) an increase in the supply of pizza.
E) a decrease in the supply of pizza.
Correct Answer:
Verified
Related Questions

