Multiple Choice
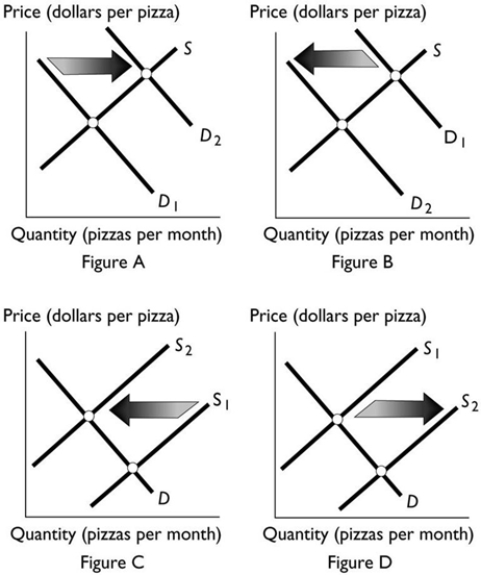 Which figure above shows the effect of a decrease in the number of pizza sellers?
A) Figure A
B) Figure B
C) Figure C
D) Figure D
E) Both Figure B and Figure C
Correct Answer:
Verified
Related Questions
Q105: Because of a sharp increase in the
Q108: Q109: Suppose the equilibrium price and quantity of Q112: Assume a market is in equilibrium. There Q112: Q114: Suppose the price of bread rises. This Q117: When laptops were first produced, the price Q118: If good weather conditions result in a Q223: Q238: Unlock this Answer For Free Now! View this answer and more for free by performing one of the following actions Scan the QR code to install the App and get 2 free unlocks Unlock quizzes for free by uploading documents![]()
![]()
![]()
![]()

