Multiple Choice
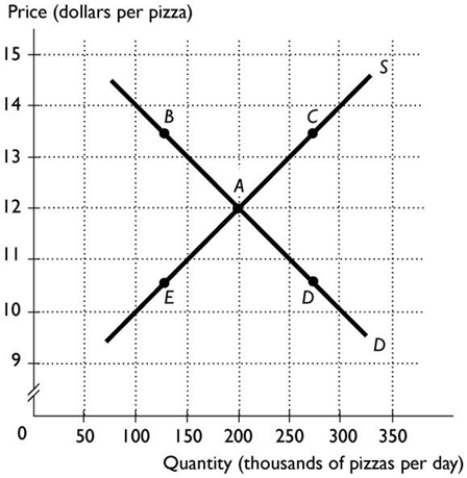 The above figure shows the market for pizza. The market is in equilibrium when the cheese used to produce pizza falls in price. What point represents the most likely new price and quantity?
A) A
B) B
C) C
D) D
E) E
Correct Answer:
Verified
Related Questions
Q99: Q100: Q101: Q108: Q111: If an early frost destroys most of Q112: Assume a market is in equilibrium. There Q113: If the price of tangerines increases, the Q114: Suppose the price of bread rises. This Q117: When laptops were first produced, the price Q235: Unlock this Answer For Free Now! View this answer and more for free by performing one of the following actions Scan the QR code to install the App and get 2 free unlocks Unlock quizzes for free by uploading documents![]()
![]()
![]()
![]()
![]()

