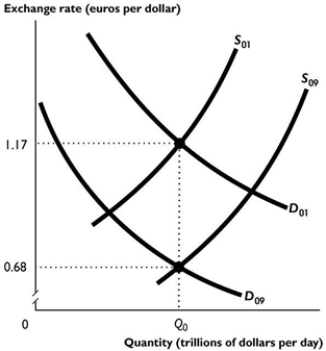
 The figure above shows the Australian market for foreign exchange in 2001 and 2009.
-Which of the following could have led to the shifts illustrated in the figure above?
i. The Australian exchange rate was expected to depreciate between 2001 and 2009.
ii. The Australian exchange rate was expected to appreciate between 2001 and 2009.
iii. The Australian interest rate rose relative to interest rates in other countries between 2001 and 2009.
A) i only
B) ii only
C) iii only
D) i and iii
E) ii and iii
Correct Answer:
Verified
Q61: The equilibrium exchange rate is 70 yen
Q62: Exchange rate changes are
A) very volatile because
Q63: The exchange rate is volatile because
A) the
Q64: Suppose the Reserve Bank wants to keep
Q65: An increase in the Australian interest rate
Q67: A situation in which money buys the
Q68: Purchasing power parity determines the exchange rate
Q69: When the Australian interest rate rises, the
Q70: Yesterday, the Australian dollar was trading in
Q71: If the interest rate on a bank
Unlock this Answer For Free Now!
View this answer and more for free by performing one of the following actions

Scan the QR code to install the App and get 2 free unlocks

Unlock quizzes for free by uploading documents