The figure above shows a nation's aggregate demand curve, aggregate supply curve, and potential GDP. 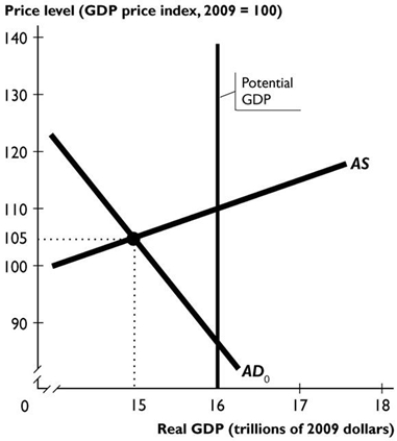
-In the figure above, the ________ gap is one trillion dollars. To close the gap, the government can ________ government expenditure and/or ________ taxes.
A) inflationary; increase; increase
B) inflationary; decrease; increase
C) recessionary; increase; decrease
D) recessionary; decrease; increase
E) recessionary; decrease; decrease
Correct Answer:
Verified
Q36: Automatic stabilisers include
A) changes in the cash
Q37: Which of the following is true?
A) Automatic
Q38: In an expansion, tax revenues increase proportionally
Q39: The magnitude of the government expenditure multiplier
Q40: The balanced budget multiplier is based on
Unlock this Answer For Free Now!
View this answer and more for free by performing one of the following actions

Scan the QR code to install the App and get 2 free unlocks

Unlock quizzes for free by uploading documents