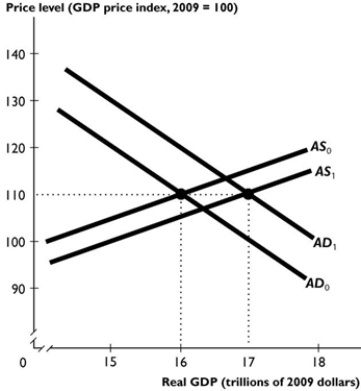
 The figure above shows an economy's aggregate demand curve and aggregate supply curve.
-Suppose the shift from AD0 to AD1 and from AS0 to AS1 is the result of fiscal policy. If the effect on aggregate demand was larger than the figure above shows, as a result the price level would be ________ 110 and real GDP would be ________ $17 trillion.
A) higher than; larger than
B) smaller than; larger than
C) equal to; larger than
D) equal to; equal to
E) smaller than; less than
Correct Answer:
Verified
Q66: Income taxes create a wedge between the
Q67: The quantity of employment is determined in
Q68: If the income tax rate is 20
Q69: A tax cut that increases the budget
Q70: How could an expansionary fiscal policy increase
Q71: If the nominal interest rate is 10
Q72: Suppose the tax rate on interest income
Q73: If we compare the United States to
Q75: If fiscal stimulus creates a large budget
Q76: When the government cuts the income tax
Unlock this Answer For Free Now!
View this answer and more for free by performing one of the following actions

Scan the QR code to install the App and get 2 free unlocks

Unlock quizzes for free by uploading documents