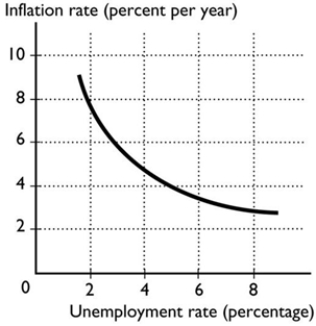
-The curve shown in the figure above is the
A) aggregate demand curve.
B) demand for money curve.
C) aggregate supply curve.
D) Phillips curve.
E) potential GDP curve.
Correct Answer:
Verified
Q9: According to Okun's Law, if the unemployment
Q10: Along a short-run Phillips curve, the
A) short-run
Q11: The short-run Phillips curve is _ curve
Q12: Comparing the aggregate supply curve and the
Q13: The short-run Phillips curve shows the relationship
Q15: Comparing the AS-AD model and the Phillips
Q16: If the price level is 100 in
Q17: According to Okun's Law, for each 1
Q18: If the economy is on its short-run
Q19: ![]()
Unlock this Answer For Free Now!
View this answer and more for free by performing one of the following actions

Scan the QR code to install the App and get 2 free unlocks

Unlock quizzes for free by uploading documents