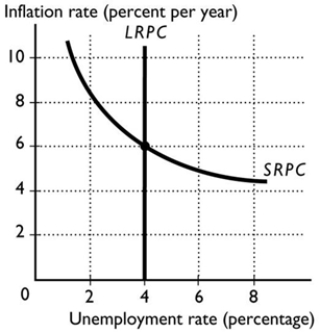
-In the figure above, the natural unemployment rate is
A) 4 per cent.
B) 6 per cent.
C) 8 per cent.
D) 0 per cent.
E) 2 per cent.
Correct Answer:
Verified
Q20: Suppose the natural unemployment rate is 5
Q21: At full employment, the expected inflation rate
Q22: Q23: If aggregate demand decreases, the Q24: In the long run, the unemployment rate Q26: On the long-run Phillips curve, the unemployment Q27: The short-run Phillips curve shows _ between Q28: If aggregate demand increases, thereby leading to Q29: In order to keep the real wage Q30: The long-run Phillips curve is _ curve![]()
A) short-run Phillips
A)
Unlock this Answer For Free Now!
View this answer and more for free by performing one of the following actions

Scan the QR code to install the App and get 2 free unlocks

Unlock quizzes for free by uploading documents