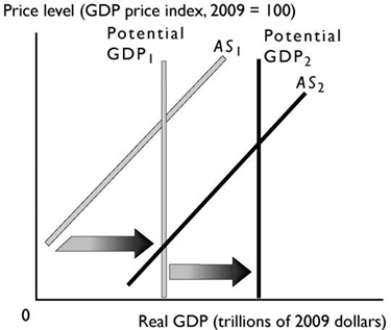
-The change in potential real GDP and aggregate supply shown in the graph above can be a result of
A) a decrease in the money price of oil.
B) an increase in the real wage rate.
C) a fall in the price level.
D) a decrease in the money wage rate.
E) an increase in the quantity of capital.
Correct Answer:
Verified
Q17: Over the business cycle, factors such as
Q18: If the price level increases from 110.0
Q19: The real wage rate definitely falls if
Q20: An increase in the price level leads
Q21: An increase in _ increases potential GDP
Q23: The aggregate demand curve shifts when any
Q24: Which of the following shifts the aggregate
Q25: A rise in the price level
A) decreases
Q26: Aggregate demand _ if the expected inflation
Q27: All of the following shift the aggregate
Unlock this Answer For Free Now!
View this answer and more for free by performing one of the following actions

Scan the QR code to install the App and get 2 free unlocks

Unlock quizzes for free by uploading documents