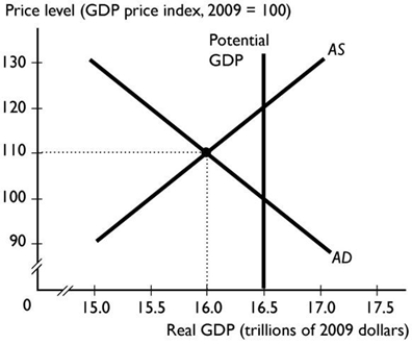
-In the figure above, the economy is at an equilibrium with real GDP of $16 trillion and a price level of 110. As the economy moves toward its ultimate equilibrium, the ________ curve shifts ________ because ________.
A) aggregate supply; rightward; the money wage rate falls
B) potential GDP; leftward; the money wage rate falls
C) aggregate supply; leftward; the money wage rate rises
D) aggregate demand; rightward; the money wage rate falls
E) aggregate demand; leftward; the money wage rate rises
Correct Answer:
Verified
Q56: Q57: The aggregate demand multiplier effect says that Q58: If investment spending increases by $1 million, Q59: A recessionary gap occurs when _ so Q60: If the economy is at macroeconomic equilibrium, Q62: Q63: The main sources of cost-push inflation are Q64: If demand-pull inflation occurs when the economy Unlock this Answer For Free Now! View this answer and more for free by performing one of the following actions Scan the QR code to install the App and get 2 free unlocks Unlock quizzes for free by uploading documents![]()
![]()

