Multiple Choice
 The graph shows a:
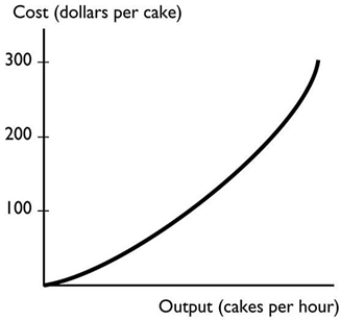
A) positive relationship that becomes steeper.
B) negative relationship that becomes steeper.
C) negative trend between the total cost of a cake and the output of cakes.
D) negative relationship that become less steep.
E) positive relationship that becomes less steep.
Correct Answer:
Verified
Related Questions
Q90: As a shoe factory adds more workers,
Q105: Which of the following statements is correct?
A)
Q106: A graph shows that the number of
Q109: A curve with a positive but decreasing
Q111: With y measured on the vertical axis
Unlock this Answer For Free Now!
View this answer and more for free by performing one of the following actions

Scan the QR code to install the App and get 2 free unlocks

Unlock quizzes for free by uploading documents