Multiple Choice
This figure illustrates changes in blood pressure when _____ feedback mechanisms are in control. 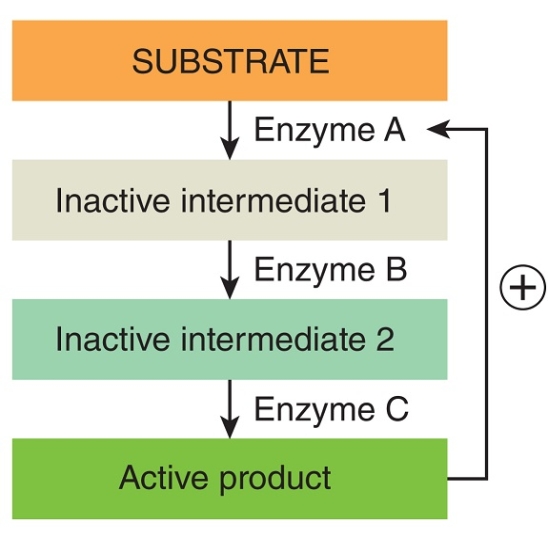
A) positive
B) negative
Correct Answer:
Verified
Related Questions
This figure illustrates changes in blood pressure when _____ feedback mechanisms are in control.
A) positive
B) negative
Correct Answer:
Verified

