Figure 29-1 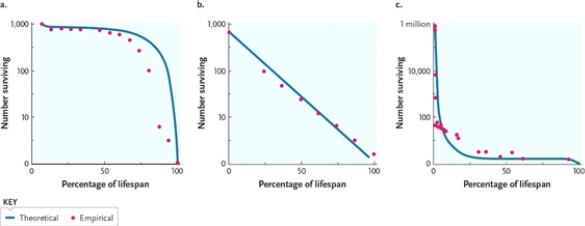
-Which survivorship curve in in Figure 29-1 best fits humans who live in environments with good medical care?
A) type I, shown in graph A
B) type I, shown in graph C
C) type III, shown in graph B
D) type III, shown in graph A
Correct Answer:
Verified
Q8: Which of the following is descriptive of
Q9: Which term refers to distributions that tend
Q10: Suppose that you are studying generation time
Q11: In which ways has the human population
Q12: Suppose that a population of 100 animals
Q14: Suppose that you want to monitor populations
Q15: Which of following factors is an intrinsic
Q16: In the logistic model of population growth,
Q17: Figure 29-1 Q18: Which factor is a density-dependent regulator of![]()
Unlock this Answer For Free Now!
View this answer and more for free by performing one of the following actions

Scan the QR code to install the App and get 2 free unlocks

Unlock quizzes for free by uploading documents