The eight panels below show average climatic values across the year on a monthly basis, as represented by first letter of each month depicted on the x-axis. Temperature values are depicted as a line graph and represented by the left vertical axis, while precipitation values are depicted as a bar graph and represented by the right vertical axis. 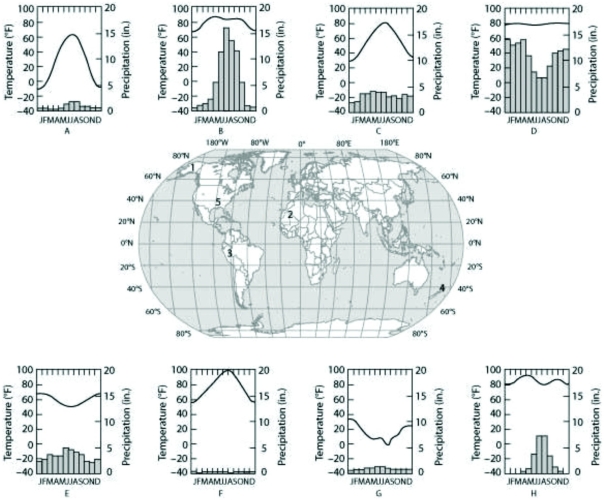 Which panel (A-H) most likely depicts the climate for location 2 as shown on the map in the center panel?
A) C
B) D
C) F
D) H
Correct Answer:
Verified
Q26: Use the following figures to answer the
Q27: Hot deserts are characterized by which of
Q28: The eight panels below show average climatic
Q29: Which of the following biomes spans the
Q30: Which of the following sources of information
Q32: The transitions in biological communities with increasing
Q33: Use the following figures to answer the
Q34: Which of the following best explains why
Q35: The eight panels below show average climatic
Q36: Which of the following biomes spans a
Unlock this Answer For Free Now!
View this answer and more for free by performing one of the following actions

Scan the QR code to install the App and get 2 free unlocks

Unlock quizzes for free by uploading documents