The graph below shows daily water potential in the xylem of a woody plant. Which of the following statements is best supported using the data? 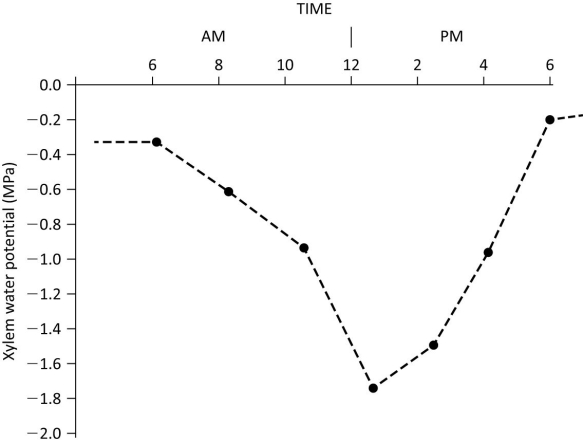
A) Water potential decreases, beginning around 6 am, because of increased mineral uptake.
B) High water potential results in greater transpiration.
C) Water potential at noon is a reflection of high rates of transpiration.
D) Increasing pressure potential after noon results in decreasing water potential.
Correct Answer:
Verified
Q22: Which of the following contribute to the
Q23: Which of the following observations provides the
Q24: The value for Ψ in root tissue
Q25: Which of the following are important components
Q26: Long-distance transport in phloem requires which of
Q28: How does the same cell differ if
Q29: If Ψ P = 0.3 MPa and
Q30: A water molecule could move all the
Q31: Which of the following best describes the
Q32: Which of the following describes the Casparian
Unlock this Answer For Free Now!
View this answer and more for free by performing one of the following actions

Scan the QR code to install the App and get 2 free unlocks

Unlock quizzes for free by uploading documents