The diagram represents the splitting of one population into two separate lineages that become more different over time (the distance between the two lines represents the amount of difference between the two lineages) . Which of the following scenarios is most likely result in the patterns shown in the diagram? 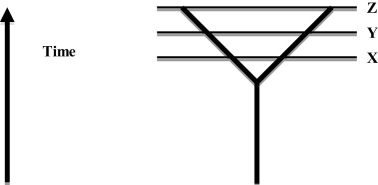
A) a glacier that retreats northward and allows contact between eastern and western populations
B) an earthquake that pushes debris into the middle of a lake and makes two unconnected lakes
C) erosion of a mountain that separated two closely related populations
D) building of a canal by people to connect two rivers
Correct Answer:
Verified
Q26: In the oceans on either side of
Q27: Which of the following methods is most
Q28: Two species of tree frogs that live
Q29: Which of the following statements best describes
Q30: In the oceans on either side of
Q32: House finches (birds) occurred only in western
Q33: New species can sometimes arise via hybridization
Q34: In the oceans on either side of
Q35: The following question is based on information
Q36: Two species of fruit flies occur on
Unlock this Answer For Free Now!
View this answer and more for free by performing one of the following actions

Scan the QR code to install the App and get 2 free unlocks

Unlock quizzes for free by uploading documents